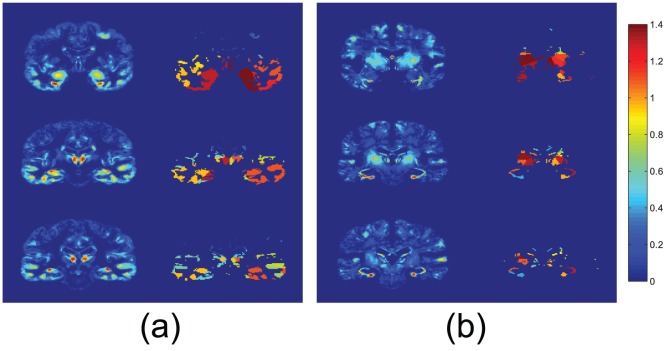
Figure 6. Difference image (right column) and ROIs computed by the proposed method (left) for (a) GM and (b) WM, respectively for CN/NOR images.
Images from a random training subset from the cross-validation folds have been used. ROIs are coloured according to the colorbar scale due to their relative importance.

