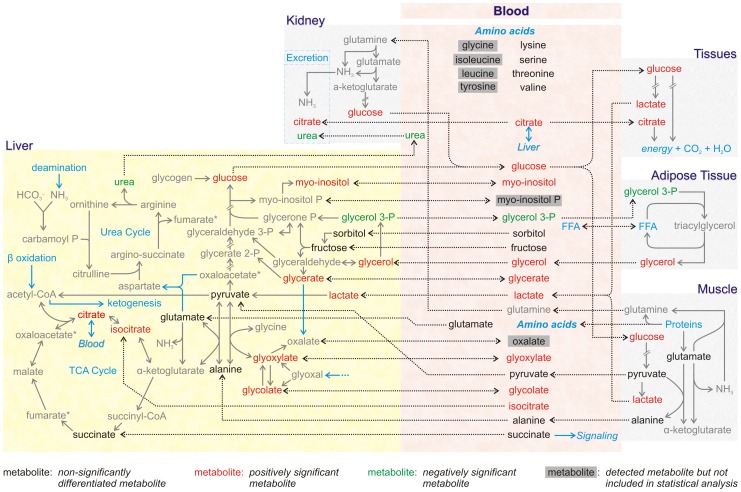
Figure 2. The significant metabolites between the ICSI and NC girl subgroups within the inter-organ metabolic network.
Positioning the significant metabolites shown in Table 3 within the reconstructed network indicates metabolic physiology differences between the ICSI and NC girl subgroups. All known metabolites detected in the plasma GC-MS metabolic profiles are shown in the area of the figure named “blood”; among these, the metabolites which were not included in the analysis after the normalization and filtering steps are shown in gray boxes. The names of the positively and negatively significant metabolites (Table 3) are shown in red and green fonts, respectively, while the nonsignificant are shown in black. The plasma metabolites are connected with dashed lines with the same metabolite pool in any of the depicted tissues. The intra-tissue pools of the plasma positively and negatively significant metabolites are shown in red and green, respectively; it is noted that we cannot predict the intra-tissue metabolite concentration from its plasma concentration, but we have tried to include the most significant tissue “sources” and “sinks” that contribute to the observed plasma concentration.

