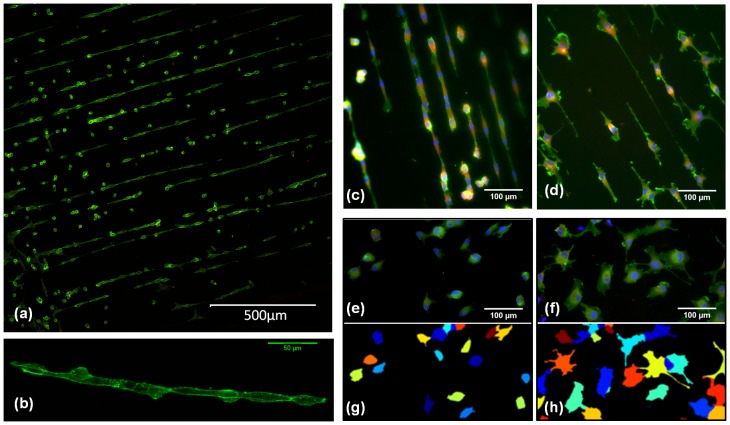
Figure 5. Modulation of endothelial cell (EC) pattern.
(a) Assembly of endothelial “cell strings” over a large area of gelatin fibril pattern. (b) An image slice of the reconstructed 3-D conformation of a selected cell string. (c) to (f) are immunostaining images of, untreated ECs on a gelatin array (c), ROCK inhibited ECs with I(5  M) on a gelatin array (d), untreated ECs on bare PDMS (e), and ROCK inhibited ECs with I(5
  M) on bare PDMS (f); (g) and (h) are the false color segmentation images for (e) and (f) respectively. Color code for immunostaining: blue = Hoechst stain, green = Phalloidin stain, and red = Vinculin anti-body stain.

