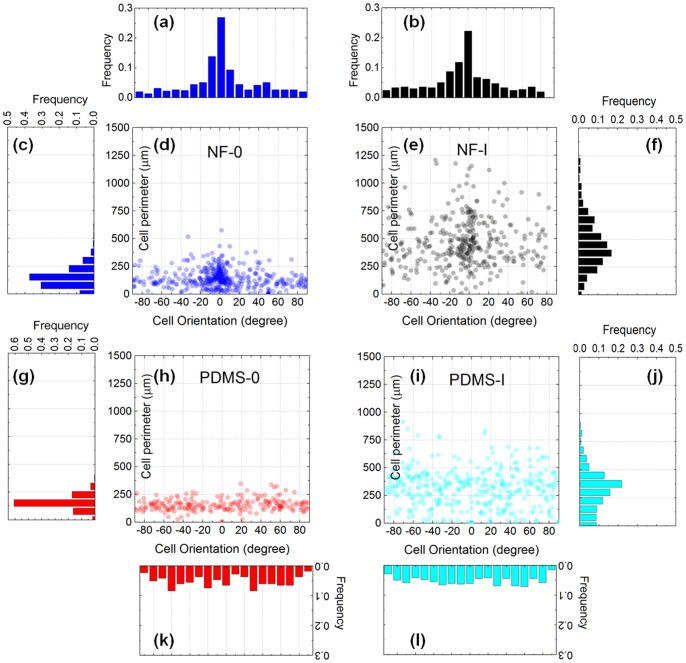
Figure 6. Effect of ROCK inhibition studied by single cell morphological statistics.
(a),(b),(k)&(l) Histograms of frequency distribution of cell orientation for untreated cells on NFES gelatin patterns (NF-0), ROCK-inhibited cells on NFES gelatin patterns (NF-I(5  M)), untreated cells on PDMS (PDMS-0), and ROCK inhibited cells on PDMS (PDMS-I(5
  M)). (c),(f),(g)&(j) The corresponding histograms of frequency distribution of cell perimeters. (d,e,h,i) The corresponding scatter plots of the cell perimeter vs cell orientation.

