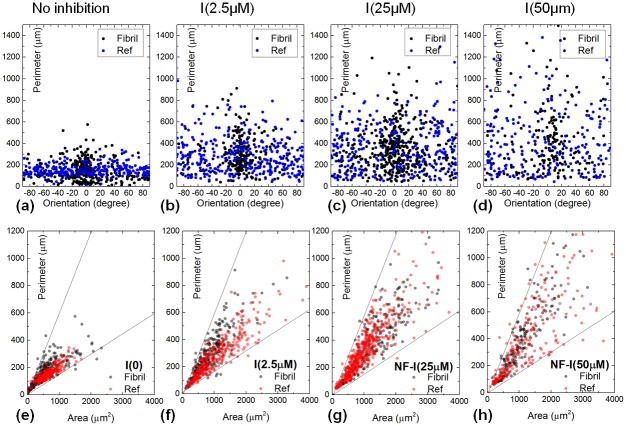
Figure 7. Dependence of cell morphology w.r.t. H1152 concentration.
(a–d) Scatter plots of cell perimeter vs. orientation for ECs subject to no ROCK inhibition, and H1152 concentration at 2.5  M, 25
M, 25  M, and 50
  M respectively. (e–h) Scatter plots of cell perimeter vs. area for ECs subjected to the same treatment.

