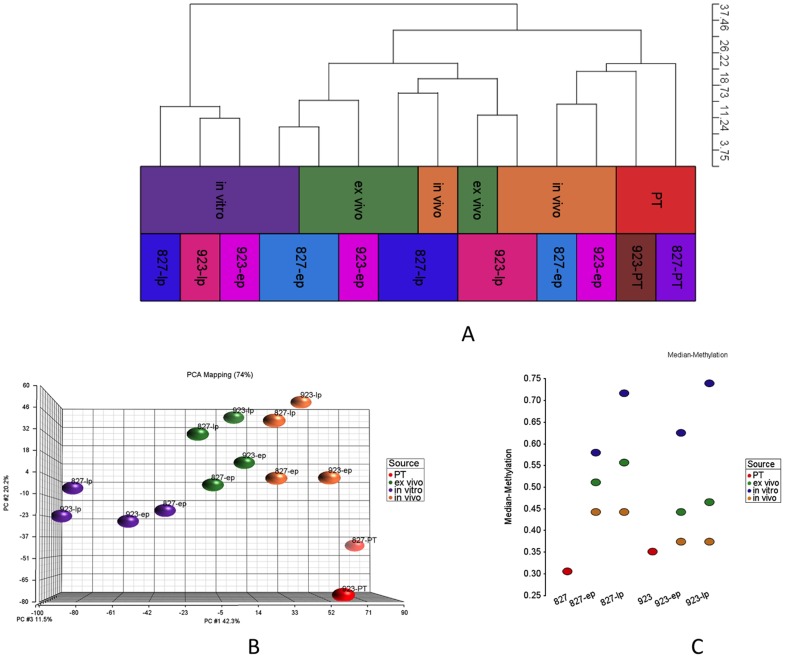
Figure 3. DNA methylation profiles of patient tumors and in vitro, in vivo, ex vivo GSCs for two cell lines.
(A,B) HC and PCA for PT, in vitro, in vivo and ex vivo samples for early and late passages (ep, lp). 6825 sites with standard deviation greater than 0.15 are presented. These sites are not differentially methylated between 827 and 923 (Mann-Whitney p-value more than 0.5). (C) Median methylation values for each sample based on selected 6825 sites.

