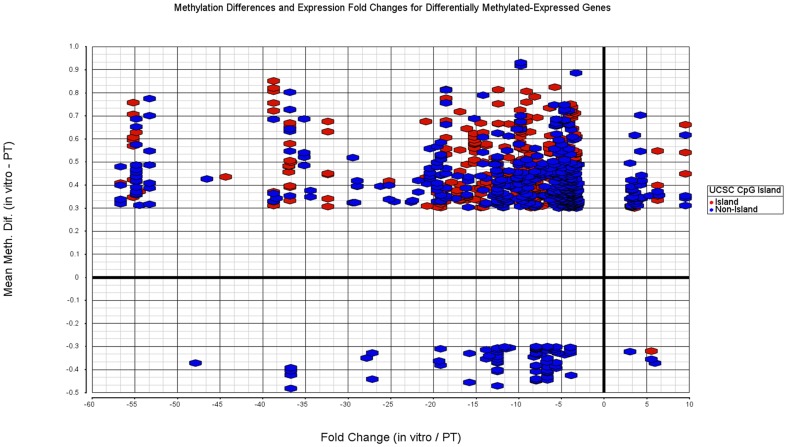
Figure 5. Fold changes (x-axis) and mean methylation differences (y-axis) between paired in vitro-PT pairs for both differentially expressed and differentially methylated genes.
Differentially expressed genes determined with paired t-test. Genes with false discovery rate less than 0.05 (Benjamini-Hochberg) and absolute fold change greater than three are used. Differentially methylated sites determined with paired non-parametric Quade test and sites with false discovery rate less than 0.05 (Benjamini-Hochberg) and absolute methylation difference greater than 0.3 are used.

