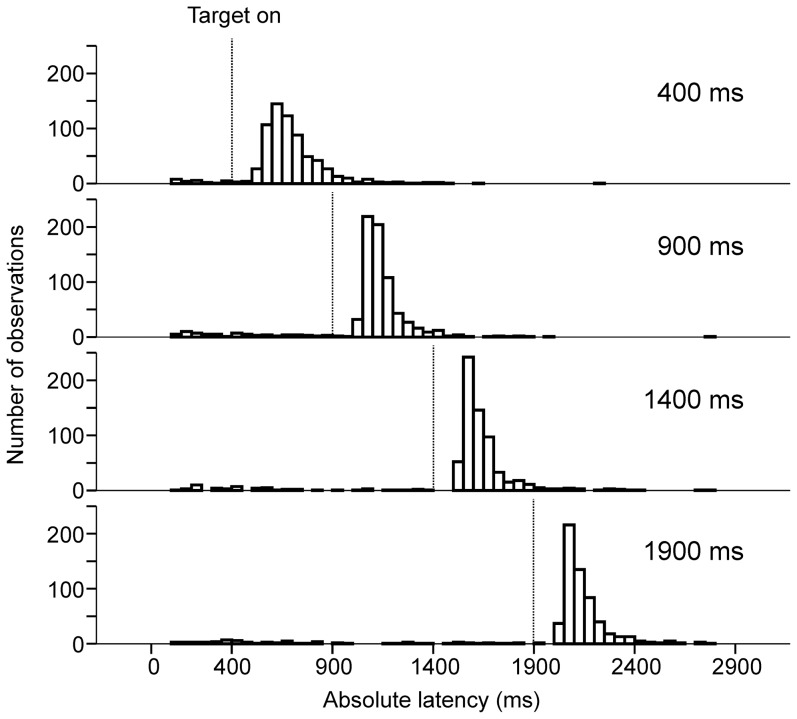
Figure 2. Histograms of saccadic absolute latencies in target trials.
Time zero on the abscissa represents the beginning of the delay period. The time elapsed until the appearance of the eccentric target is represented with vertical dashed lines for the four different durations tested. The ordinate represents the number of saccades in the 10-ms bins.

