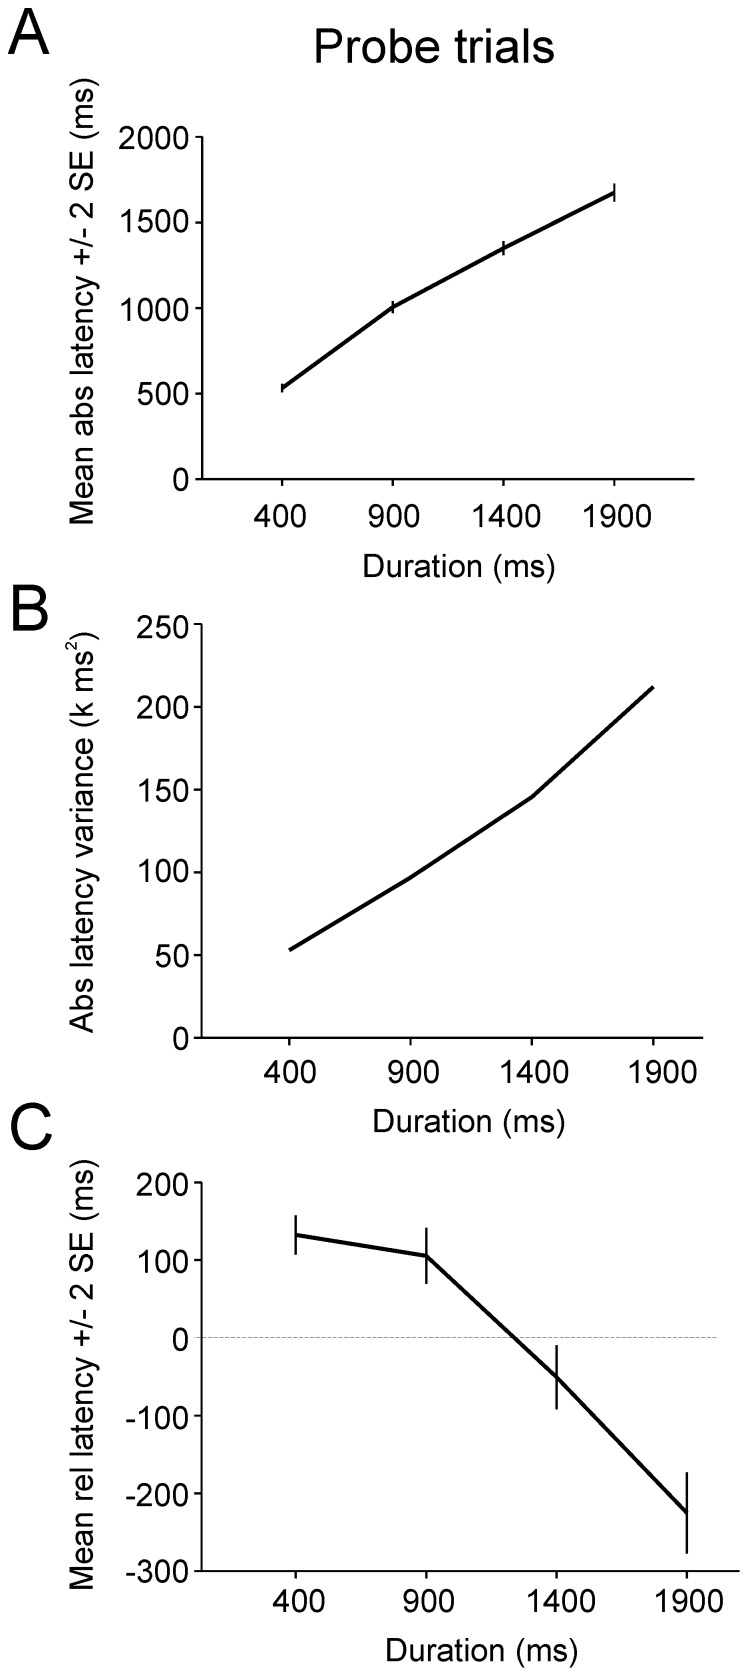
Figure 9. Group data in probe trials.
A: mean absolute latency (±2 SE) as a function of delay duration. B: Latency variance for the same data. C: Mean relative latency (±2 SE). The horizontal dashed line represents the transition between saccades occurring after the end of the cued duration (positive values) or before (negative values).

