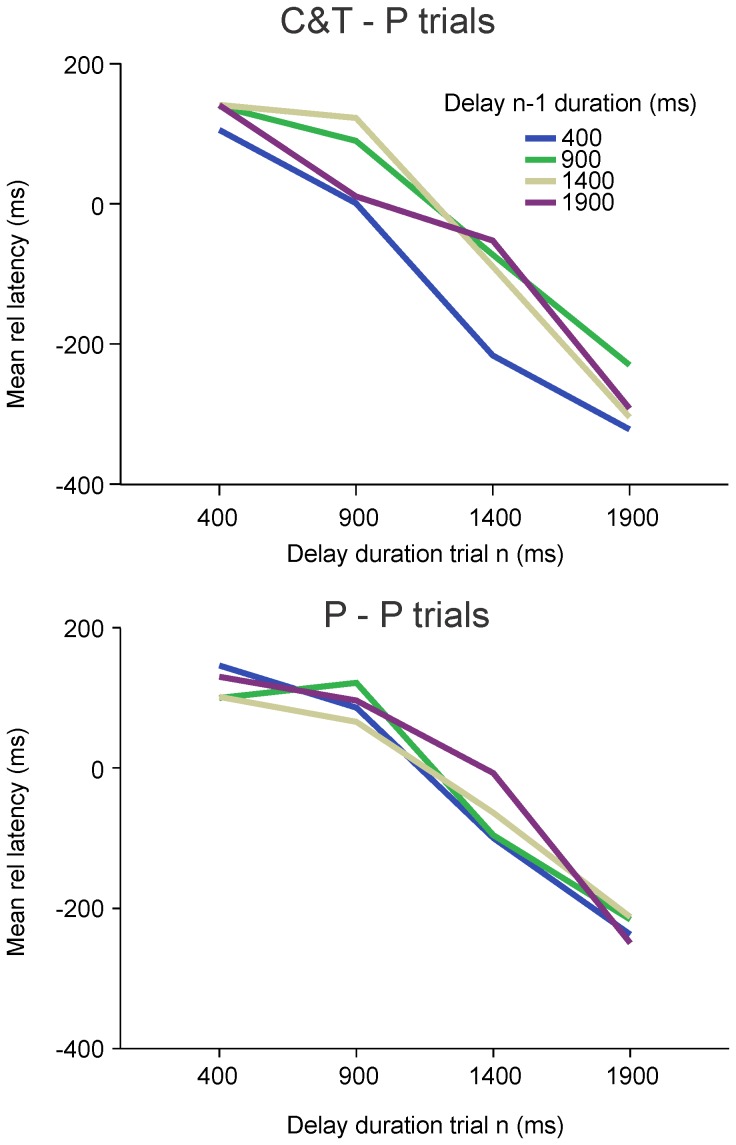
Figure 10. Influence of previous trial type on sequence effect.
Y-axis: mean relative latency in milliseconds. X-axis: duration of the delay (cue) during trial ‘n’. Colors: delay (cue) duration during trial ‘n-1’. A: Probe trials preceded by a cue&target trial. B: Probe trials preceded by a probe trial.

