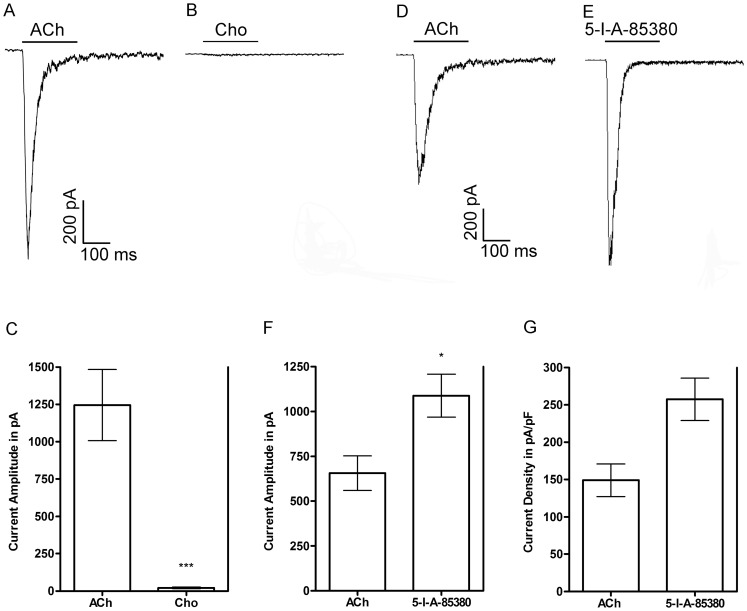
Figure 2. Representative trace recordings of agonist-evoked currents from monkey adrenal chromaffin cells.
A and B, Current traces of ACh- and choline-evoked currents from a single cell. C, Quantitative comparison of the current amplitudes evoked by each respective agonist. Responses to 10 mM choline were compared to the average responses evoked by 300 μM ACh in the same cells; the error bars denote the S.E.M. (n = 4) and the asterisks denote statistical significance (***p<0.0001) as determined by a one sample t-test. D and E, Current traces of ACh- and 5-I-A-85380-evoked currents from a single cell. F, Quantitative comparison of the current amplitudes evoked by each respective agonist. Responses to 100 μM 5-I-A-85380 were compared to the average responses evoked by 300 μM ACh in the same cells; the error bars denote the S.E.M. (n = 4) and asterisk denote statistical significance (*p<0.05) as determined by a one sample t-test. G, The current amplitudes shown in F were normalized to membrane capacitance and shown as an expression of current density in pA/pF. The differences between the current densities produced by the two agonists were not statistically significant as determined by a Wilcoxon signed rank test (p = 0.0625).

