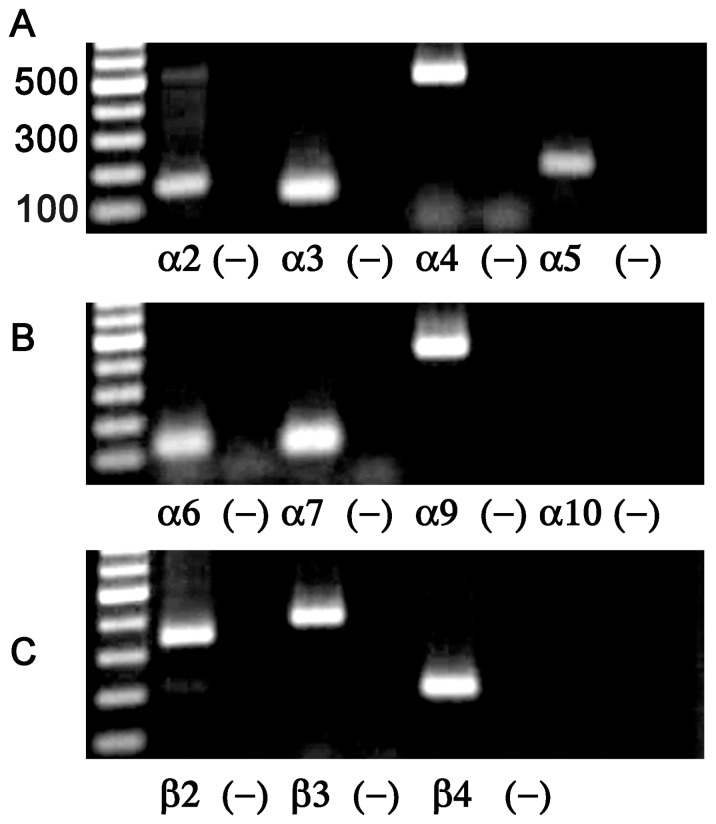
Figure 3. PCR analysis of the nAChR subunit transcripts present in monkey adrenal gland.
A-C, PCR products for the nAChR subunits α2–α7, α9, α10, and β2–β4 were analyzed by agarose gel electrophoresis and visualized using ethidum bromide fluorescence. Negative controls for each reaction were performed by omission of the cDNA template and the results are shown in the lanes immediately to the right for each respective subunit.

