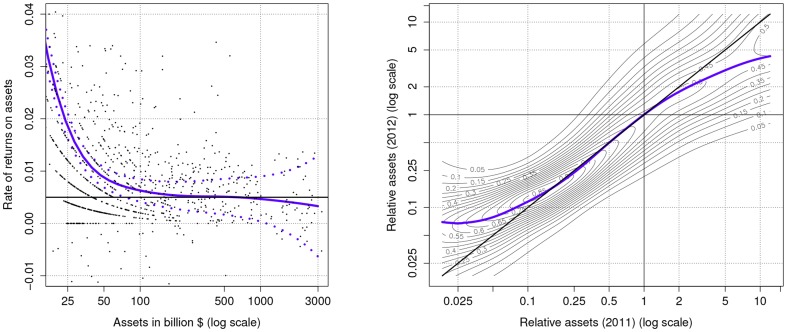
Figure 2. Left panel: non-parametric estimate of the relationship between the rates of return on assets and the levels of assets (bold line, dotted lines refer to  confidence interval).
Right panel: estimate of the stochastic kernel (i.e. of the conditional probability distribution), and of the expected level of assets in 2012 conditioned on the level of assets in 2011 (light grey lines and bold blue line respectively). Both plots refer to financial firms in the 2012 and 2013 FG2000 lists.

