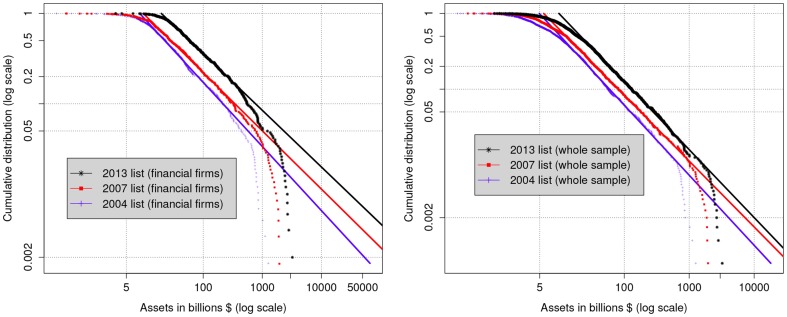
Figure 3. Cumulative distribution  of asset sizes
  for financial (left panel) and all (right panel) firms in 2003, 2006, and 2012 (2004, 2006, and 2013 of FG2000 lists).
The straight line is obtained as a linear fit in an intermediate range of  vs
vs  (see Table 1).

