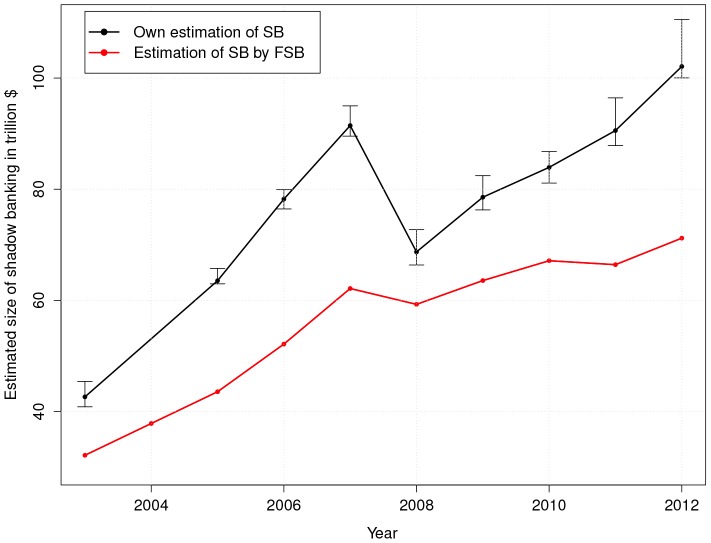
Figure 4. Comparison between our index of SB,  , with the estimate of the size of SB made by FSB [19] for the period 2003–2012.
The reported confidence bands for our estimate of SB are calculated on the basis of  standard errors in the estimate of the coefficients of the power law distributions.

