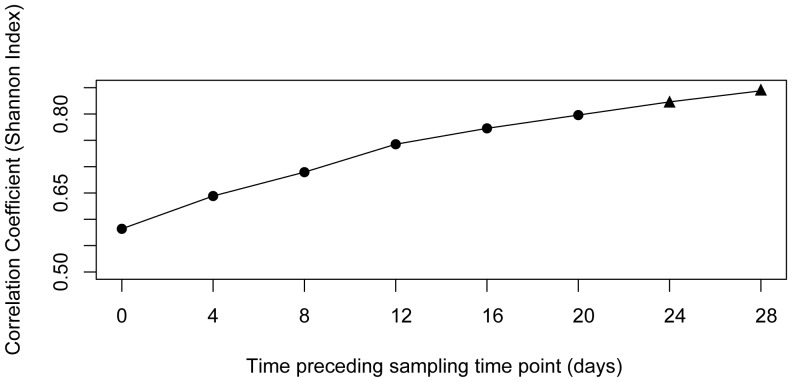
Figure 3. Lag analyses for the correlation between diversity (Shannon Index) and mean temperature integrated over 28 days prior to the sampling event.
Day 0 corresponds to the temperature measured at the sampling day representing an immediate response, while day 28 uses the mean temperature of the previous month representing a slower response to temperature shifts. Significant correlations between diversity and temperature are depicted by black triangles.

