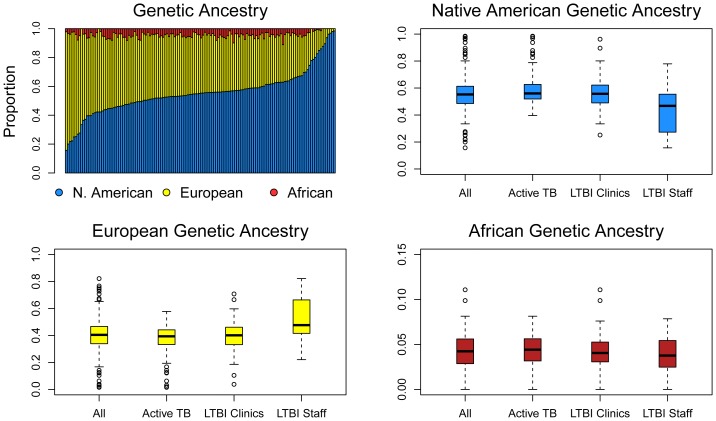
Figure 1. Bar plot and box and whisker plots of genome-wide genetic ancestry for 142 genotyped individuals.
The bar plot shows genetic ancestry for each individuals arrayed from lowest to highest Native American genetic ancestry. Native American genetic ancestry ranged from 15.7% to 98.5%, with a mean of 55.6%. European genetic ancestry ranged from 1.5% to 82.1%, with a mean of 40.2%. African genetic ancestry ranged from 0.0% to 11.1%, with a mean of 4.2%.

