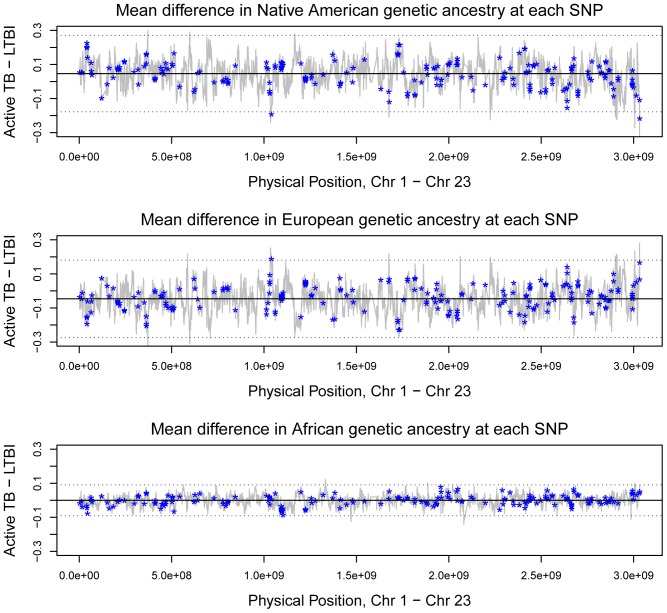
Figure 2. Genetic ancestry at each SNP.
The y-axes in the three plots show the differences in Native American, European, and African genetic ancestry between individuals with TB disease and LTBI at each SNP. The x-axes show the physical position of each SNP, with the chromosomes plotted in order beginning with chromosome 1. The dashed lines indicate three standard deviations from the mean difference in genetic ancestry.

