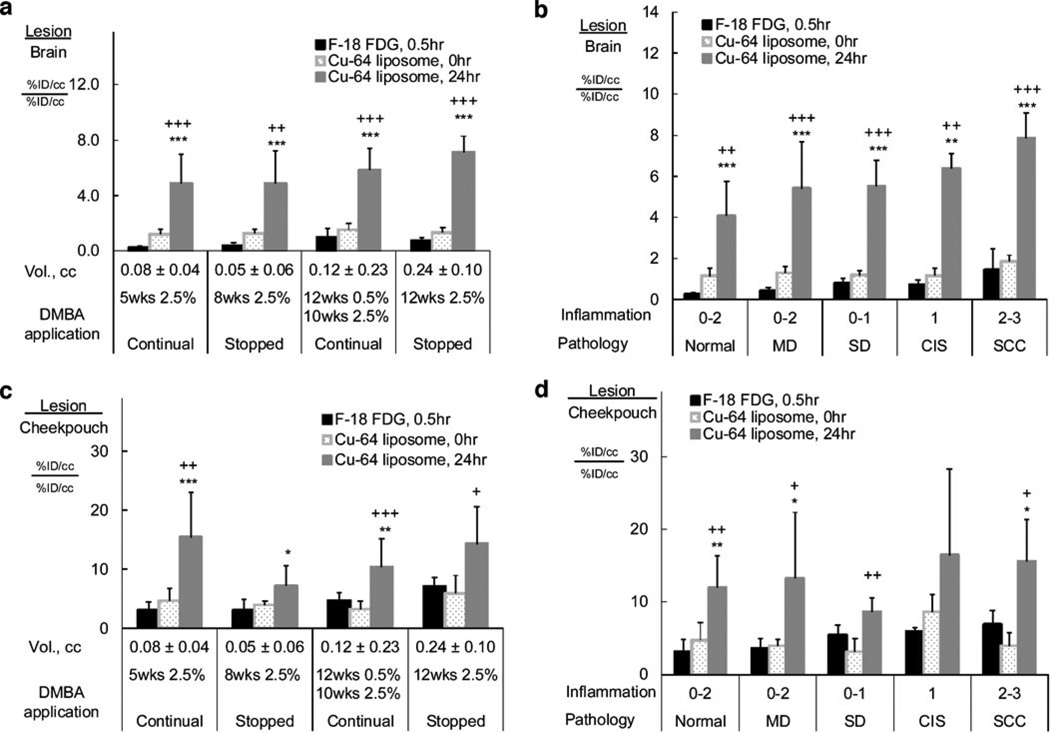
Fig. 6.
The ratios of accumulation in lesion vs brain (a and b) and lesion vs cheek pouch background (c and d): a and c, grouped by DMBA application patterns; b and d, grouped by pathological grades. In each case, the lesion-to-brain or cheek pouch ratios are higher in 64Cu-liposome 24-h images than in 18F-FDG images. Statistical significance is shown as follows: asterisk, 18F-FDG vs 64Cu-liposomes; plus sign, 64Cu-liposomes 0 vs 24 h; single symbol, p < 0.05; double symbols, p < 0.01; triple symbols, p < 0.001.

