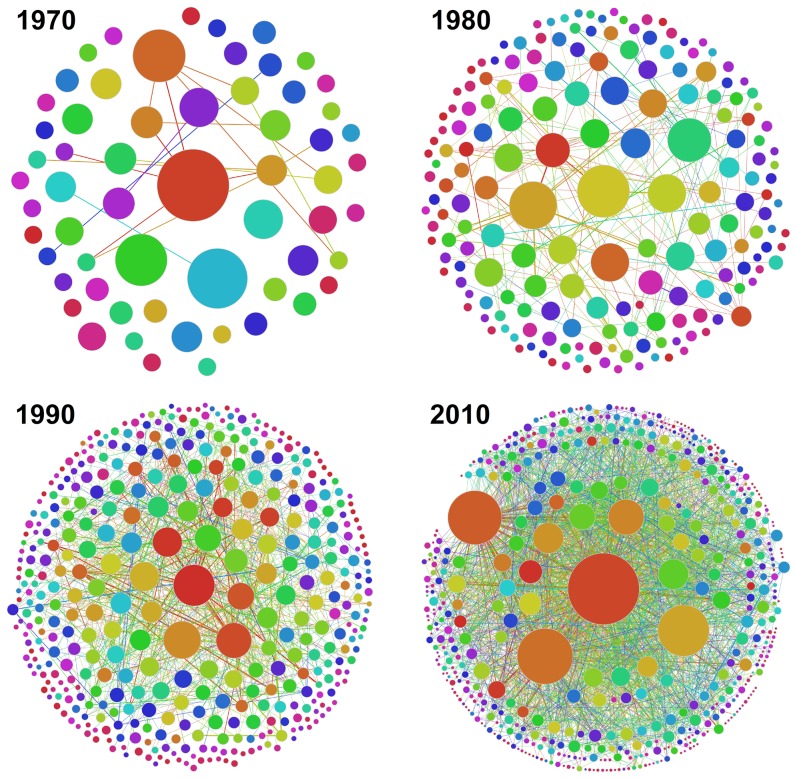
Figure 2. Evolution of the community structure of Slovenian scientific coauthorship network, as determined by the COPRA algorithm.
Depicted are the communities and the links between them as obtained for  ,
,  ,
,  and
and  . The total number of communities (with five or more members) increases from
  (
( ) in the year
  to
to  (
( ) in the year 2010. The size of the largest community also increases from
  to
to  members during the same time span, and so does the interdisciplinarity from
  to
to  . Based solely on the analysis of the largest community, one might be tempted to conclude that interdisciplinary research in Slovenia is on the rise. But, as evidenced by the results presented in Fig. 3 and Table 1, this would be a deceitfully optimistic conclusion. The size of each depicted community is proportional to the number of its members, and the thickness of links connecting them is proportional to the logarithm of the number of edges between them. Colors are just to distinguish the communities. Other community detection algorithms yield qualitatively similar results.

