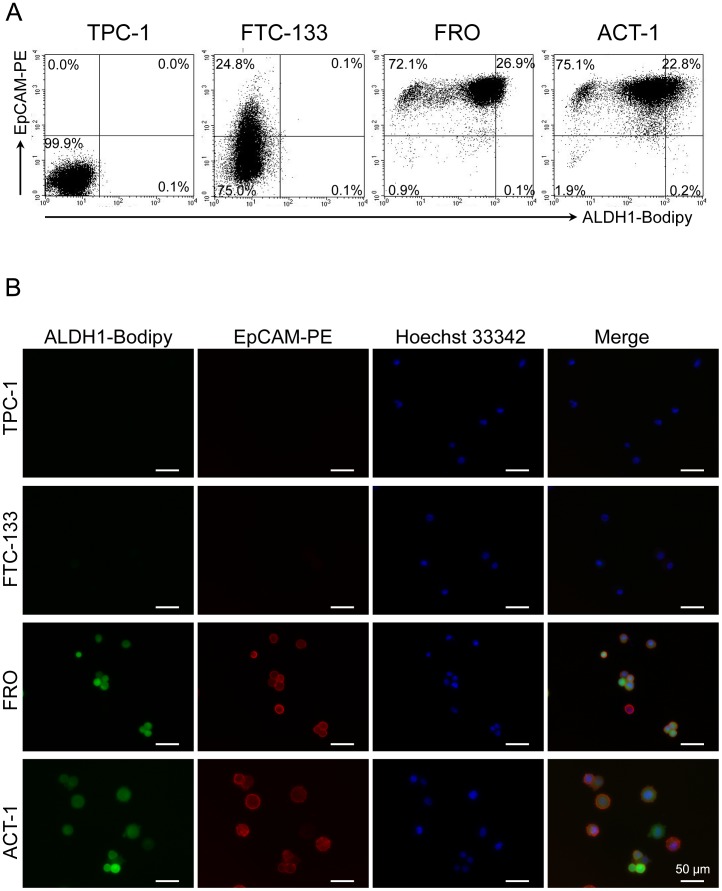
Figure 6. ALDH1 enzymatic activity and EpCAM expression in thyroid cancer cell lines.
(A) Four thyroid cancer cell lines were tested for expression of EpCAM and ALDH1 enzymatic activity by flow cytometry. The number indicated the percentage of the cells in each subset. (B) Immunofluorescence finding of ALDH1 and EpCAM in indicated cell lines. Fluorescence of PE-conjugated EpCAM (red) and ALDH1-Bodipy (green) were examined under a fluorescence microscope. Nuclei were stained blue with Hoechst 33342. Scale bar = 50 µm.

