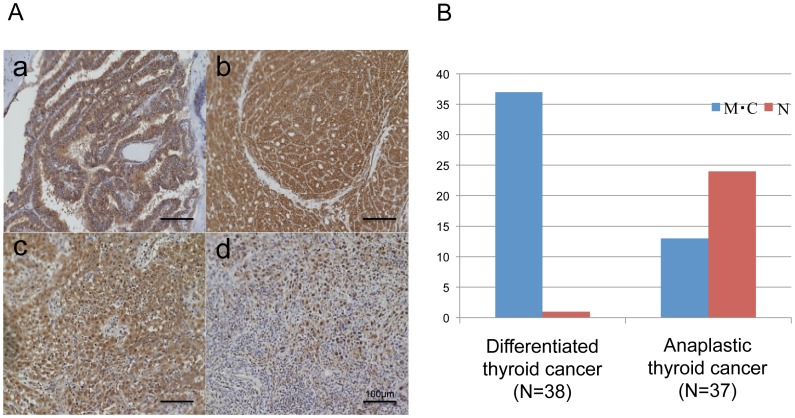
Figure 7. Immunohistochemical analysis of expression of EpCAM in clinical thyroid cancers.
(A) Representative findings of immunohistochemical analysis of EpCAM in clinical thyroid cancer specimens; a, membranous and cytoplasmic staining in papillary thyroid cancer; b, membranous and cytoplasmic staining in follicular thyroid cancer; c, cytoplasmic and nuclear staining in anaplastic thyroid cancer; d, nuclear staining in anaplastic thyroid cancer. Scale bar = 100 µm. (B) Localization of EpCAM in the differentiated thyroid cancers and the anaplastic thyroid cancers in clinical specimens. Blue bars indicate the number of tumors showed membranous (M) or cytoplasmic (C) expression of EpCAM, and red bars indicate the number of tumors showed nuclear (N) expression.

