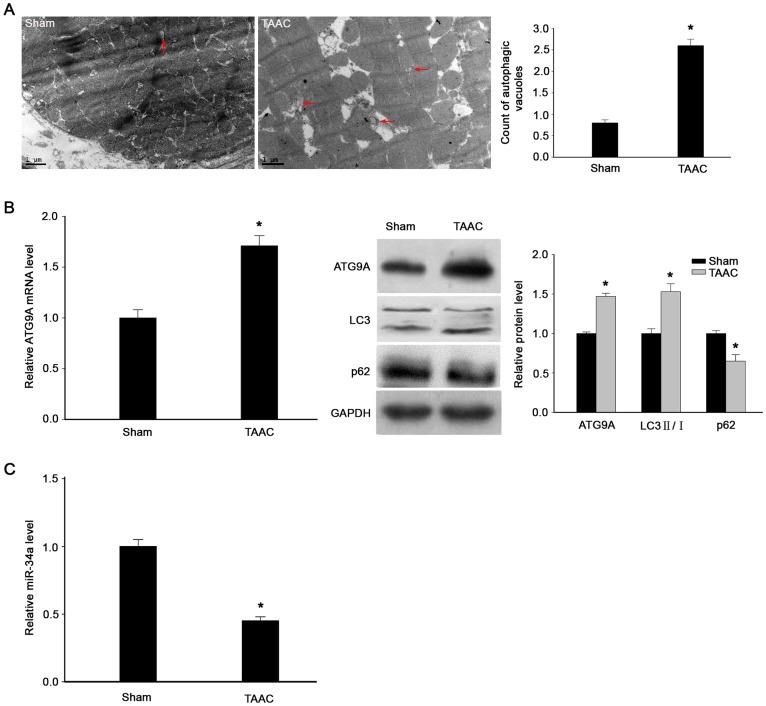
Figure 2. Altered miR-34a and ATG9A expression, autophagic vacuoles, and autophagy in a rat cardiac hypertrophy model.
(A) The autophagic vacuoles in left ventricular tissues from Sham and TAAC rats were analyzed 4 weeks after surgery by transmission electron microscopy (arrows indicated). Magnification, ×13500. Scale bar: 1 µm. The graph summarizes the data on changed autophagic vacuoles in TAAC vs. Sham rats. *P<0.05 compared with the Sham group. (B) Gene expression analyzed by qRT-PCR and Western blotting. The graph quantifies the Western Blot data. *P<0.05 compared with the Sham group. (C) qRT-PCR detection of miR-34a expression. U6 was used as an internal control. Data are presented as means ± SEM. *P<0.05 compared with the Sham group.

