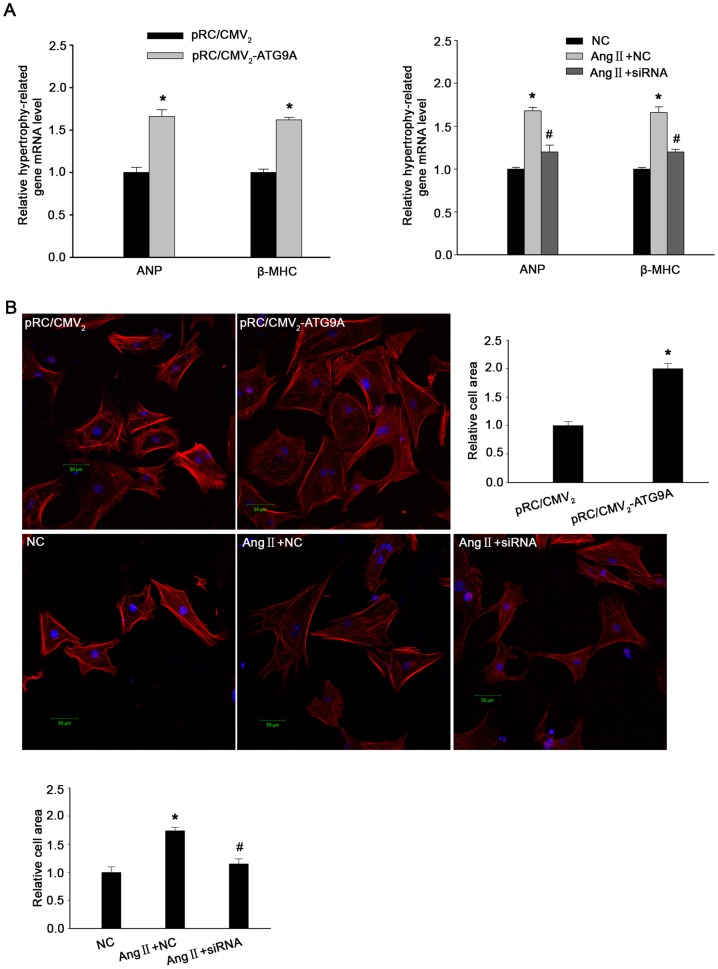
Figure 7. Effect of altered ATG9A expression on Ang II-induced myocardial hypertrophy.
(A) qRT-PCR. The cardiomyocytes transfected with ATG9A cDNA or vector control or lentiviral control or treated with Ang II plus ATG9A siRNA or lentiviral control and then subjected to qRT-PCR analysis of the hypertrophy-related genes ANP and β-MHC mRNA. (B) Confocal microscopy. The cardiomyocyte morphology was measured by a confocal microscope after staining with Alexa Fluor555 Phalloidin and DIPI. The graph summarizes the confocal microscopy data. *P<0.05 compared to control; #P<0.05 compared to Ang II + NC.

