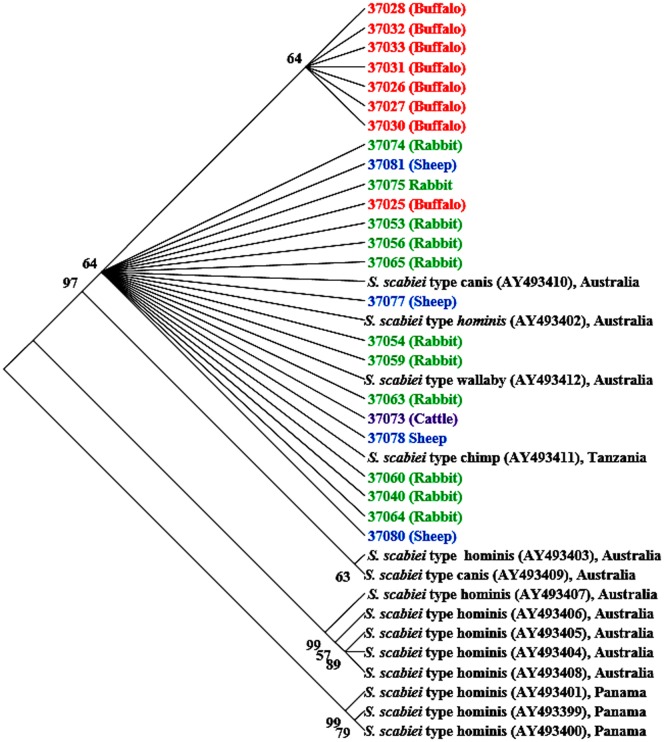
Figure 3. Un-rooted NJ tree of showing genetic relationship of Egyptian Sarcoptes mites to others in the GenBank database based on mitochondrial 16S rRNA sequences.
Evolutionary relationships of 38 taxa were inferred using the neighbor-joining [46]. Numbers at the internodes correspond to percent bootstrap values from 2,000 replicates. Branches corresponding to partitions produced in less than 50% bootstrap replicates are collapsed. Sequences in bolded colors and with no GenBank accession numbers are generated from Egyptian specimens.

