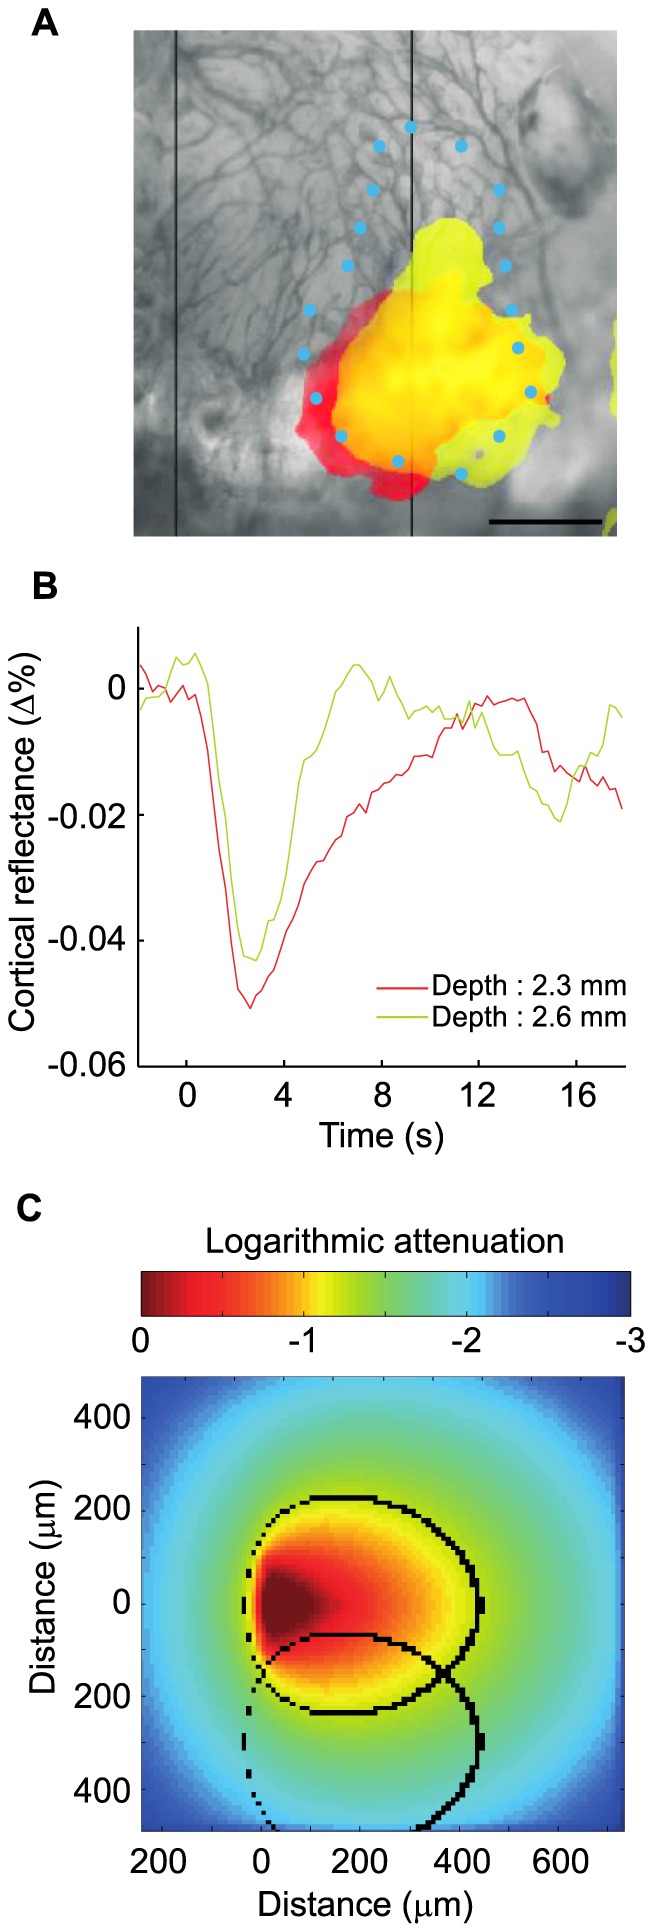
Figure 6. Optical fiber translation in the LGN.

A. Moving the optical fiber by 300 µm along its axis (1.5× the fiber diameter) enabled to see different activation areas (p<0.01). Scale bar: 1 mm. Light intensity at fiber tip: 8.9 mW/mm2. Blue dots represent V1 delineation according to atlas. B. Hemodynamic response functions associated with activation areas presented in (A). C. Monte Carlo simulations. Black ovals represent boundaries where neurons are illuminated by a fluence >0.5 mW/mm2, for two positions of the optical fiber translated 300µm along its axis.
