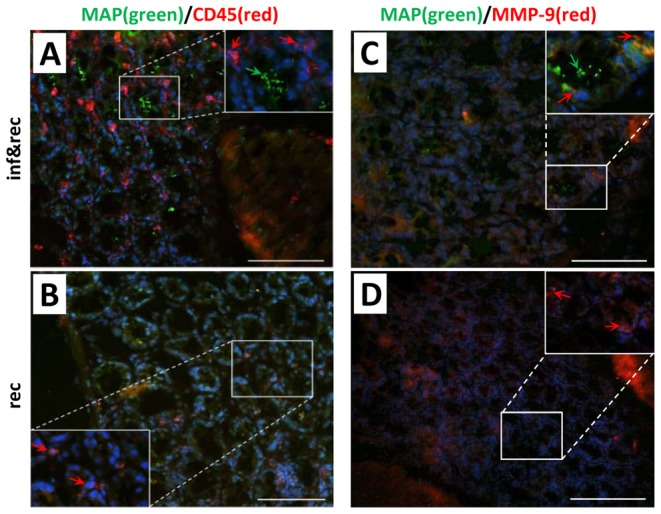
Figure 7. Immunofluorescence staining of murine colon from MAP infected Rag2−/− mice reconstituted with CD4+CD45RBlo/int T-cells and in non-infected but reconstituted mice for control.

A–B. Samples were stained for MAP (green) and leukocytes (CD45: red). Green arrows indicate colonies of MAP in the epithelium and red arrows indicate leukocytes most likely macrophages. C–D. Samples were stained for MAP (green) and MMP-9 (red). Green arrows indicate colonies of intracellular MAP. Red arrows indicate MMP-9 expressing leukocytes. In reconstituted and non-infected mice no MAP clusters could be detected and showed a normal histology of colon mucosa. Magnification 200x&1000x, bar = 100 µm. Blue staining in all samples: DAPI. The data are representative from 4 mice per group and the experiment was carried out at least twice with similar results.
