Figure 3.

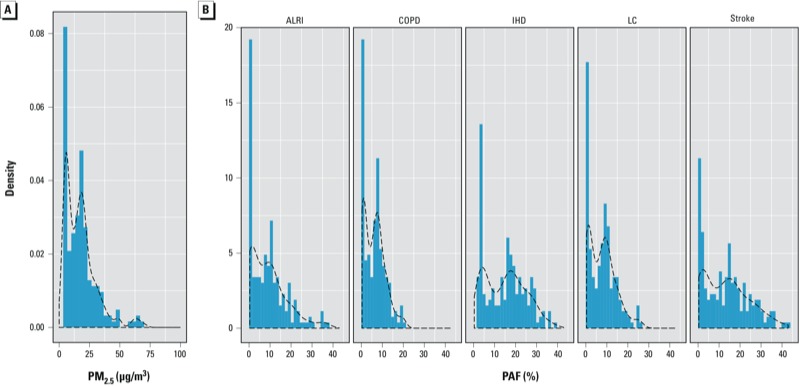
Density plots of country-specific, population-weighted PM2.5 concentrations (μg/m3) (A) and PAFs (B) by risk model and health outcome. Dashed lines represent smooth fit of density function.

Density plots of country-specific, population-weighted PM2.5 concentrations (μg/m3) (A) and PAFs (B) by risk model and health outcome. Dashed lines represent smooth fit of density function.