
Figure 2.
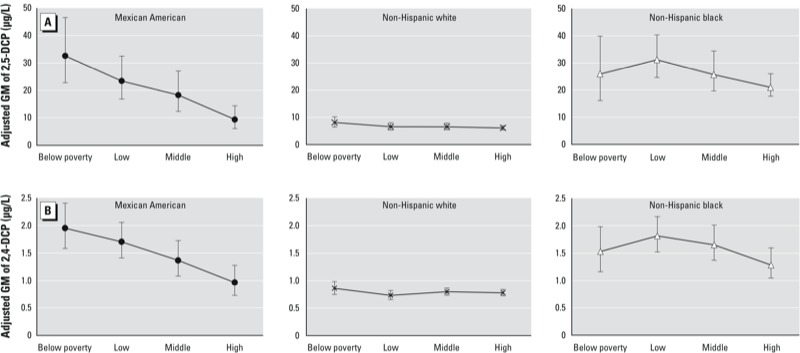
Adjusted GM urinary concentrations (μg/L) of 2,5-DCP (A) and 2,4-DCP (B) by family income categories. Below poverty, PIR < 1; low, PIR = 1–1.93; middle, PIR = 1.93–3.71; high, PIR > 3.71. Adjusted GMs were estimated using the regression equation with the intercept and regression coefficient for a given level of the categorical variable specified, and multiplying the β coefficient for all other categorical covariates by their estimated weighted percentage distribution. Error bars represent 95% CIs.