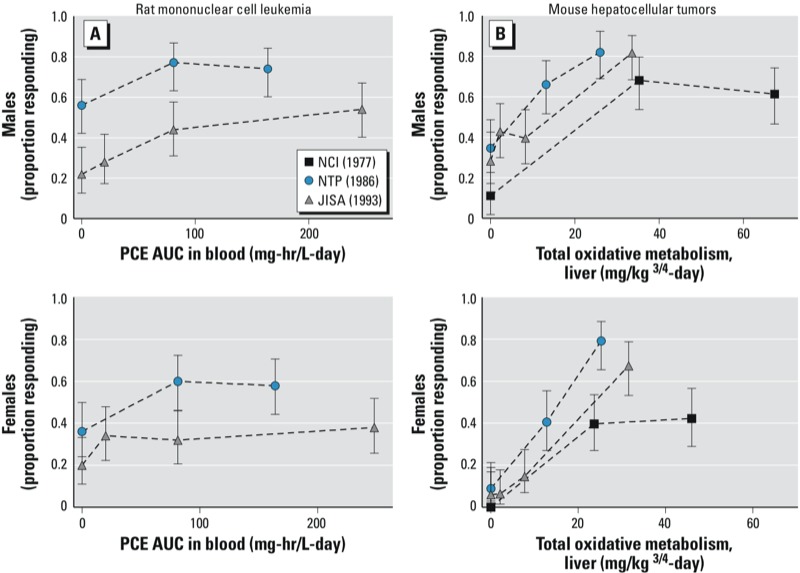
Figure 2.

Dose–response relationships for rat mononuclear cell leukemias (A) and mouse hepatocellular tumors (B) in PCE bioassays. Three laboratories evaluated PCE in both mice and rats [oral gavage (NCI 1977); inhalation (JISA 1993; NTP 1986)]. The PBPK model of Chiu and Ginsberg (2011) was used to estimate internal dose for each site, allowing comparison of responses across routes of exposure. The best supported dose metric for mouse liver tumors was total oxidative metabolism in the liver (B), whereas that for rat mononuclear cell leukemia was PCE area under the curve (PCE AUC) in blood (A). The study in Osborne-Mendel rats (NCI 1977) was judged inconclusive because of high rates of respiratory disease and mortality with PCE and, thus, rat data from that study are not presented. Survival-adjusted responses are presented as proportion responding (incidence/number at risk).
