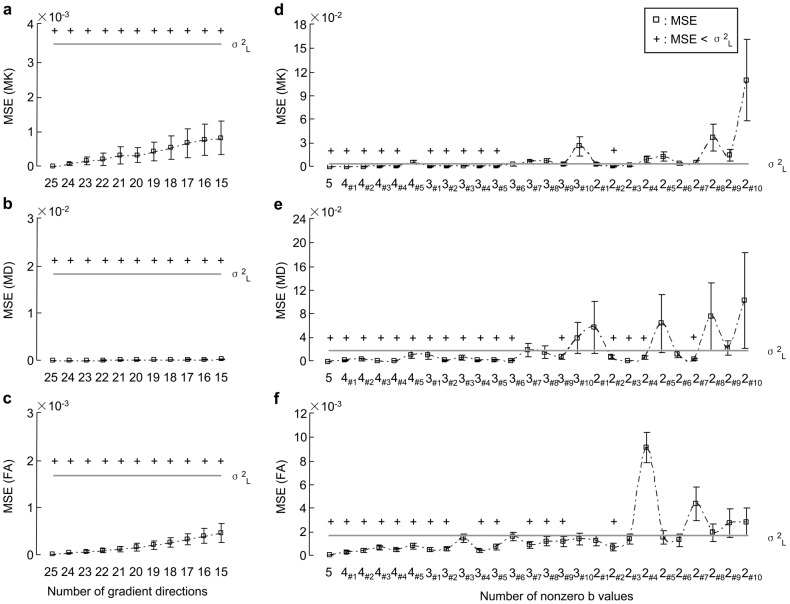
Figure 3. MSEs of MK, MD, and FA estimated on the datasets of the different protocols.
The derived parameters were estimated by using the proposed workflow. The protocols included (a∼c) 15∼25 out of 25 gradient directions, and (d∼f) 2∼5 nonzero b values (the combinations of nonzero b values were listed in Table 1). Scatter plots and error bars were the inter-subject averages and standard deviations of MSEs for artifact-free datasets (n = 5), respectively. The cross (+) represented that MSE was less than the low bound of σ2 (σ2 L), where σ2 L = mean (σ2) – standard deviation (σ2).

