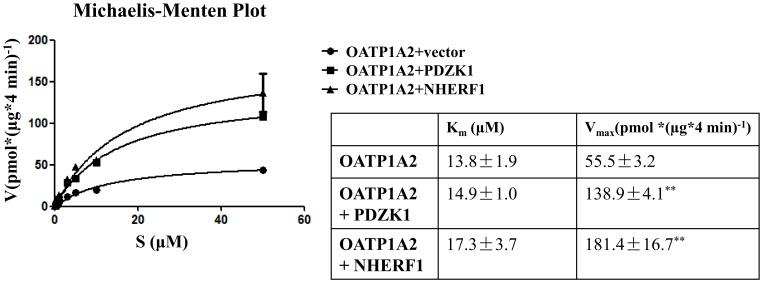
Figure 3. Michaelis-Menten plot of E3S transport kinetics by OATP1A2 with or without co-transfected PDZK1 or NHERF1.
E3S uptake was conducted over a 4-specific uptake by vector transfected cells and was also standardized to the amount of protein in each well. Kinetic parameters were calculated by nonlinear regression. Values are means ± S.E. (n = 3). **: Different from control: P<0.01.

