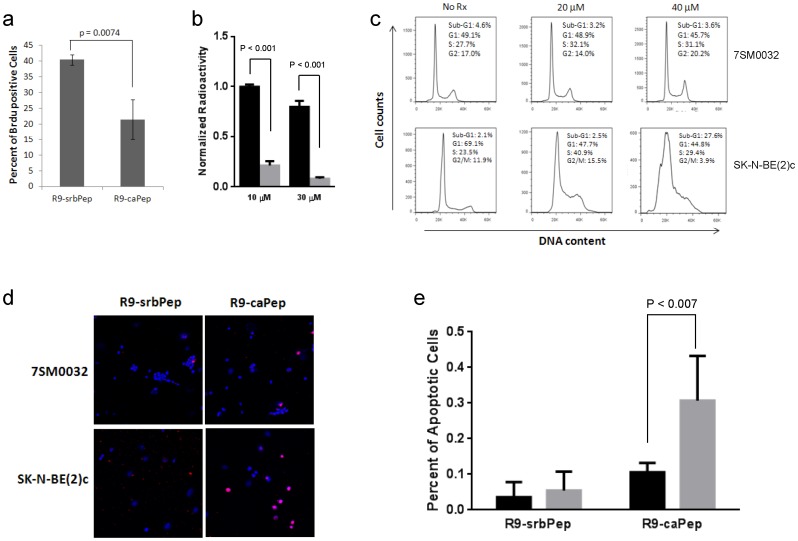
Figure 3. Inhibition of DNA replication and induction of S-phase arrest and apoptosis by R9-caPep.
a) SK-N-BE(2)c cells were pulsed in 10 µM of BrdU for 30 min after being pre-treated with R9-caPep or R9-srbPep for 7.5 h. The relative abundances of BrdU-positive cells in triplicates were averaged and graphed plus/minus standard deviations. b) Nuclear extracts from SK-N-BE(2)c cells were incubated with the indicated concentrations of R9-caPep (grey bars) or R9-srbPep (black bars) for 20 min. SV40 T-antigen was then added to the nuclear extracts along with premixed reaction buffer containing 32P dCTP. A complete reaction mixture except for SV40 T-antigen was used as control for T-antigen-independent nucleotide incorporation. The polymerized radioactivity was measured by a scintillation counter. The T-antigen-dependent incorporation of 32P dCTP was calculated by subtracting T-antigen-independent radioactivity from the total radioactivity and was normalized to the T-antigen-dependent radioactivity in PBS-treated samples. Triplicates of normalized T-antigen-dependent radioactivity for each treatment condition were averaged and graphed plus/minus standard deviations. c) SK-N-BE(2)c and non-malignant 7SM0032 cells were fixed and stained with propidium iodide (PI) after being treated with the indicated concentrations of R9-caPeptide for 48 h. The cellular PI fluorescence intensity determined by flow cytometry was analyzed by the FlowJo to model various cell populations. d) Cells grown on chamber slides were treated by R9-caPep or R9-srbPep at 40 µM for 48 h. Cells were fixed and analyzed by a TUNEL assay. Cells were imaged by a confocal microscope. TMR-red is the fluorophore that was attached to the free DNA ends. DAPI (blue) indicates the location of nuclei. The pink dots derived from the merged TMR-red and DAPI staining indicate apoptosis. e) The abundance of apoptotic cells relative to the total number of cells in six randomly selected fields were averaged and graphed plus/minus standard deviations (right). The dark and gray bars represent results from 7SM0032 and SK-N-BE(2)c cells respectively.

