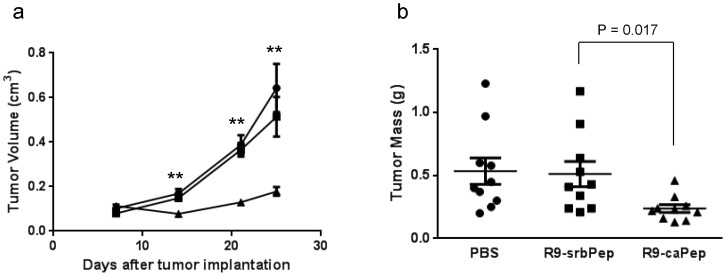
Figure 6. Inhibition of tumor growth by R9-caPep in vivo.
a) Nude mice were randomly divided into 3 groups of 10 mice after each being injected with 5×10⁶ SK-N-BE(2)c cells in Matrigel. Each group was treated with PBS (circle), R9-srbPep (square), or R9-caPep (triangle) by intratumoral injection. Tumor sizes were measured at the indicated time points and tumor volumes were estimated based on the length and width of the tumors (V = L×W2×0.5). The mean tumor volume for each treatment group was graphed plus/minus standard errors. ** indicates p<0.01. b) Tumor masses were measured at the end of the experiment and graphed in a scatter plot with mean plus/minus standard errors.

