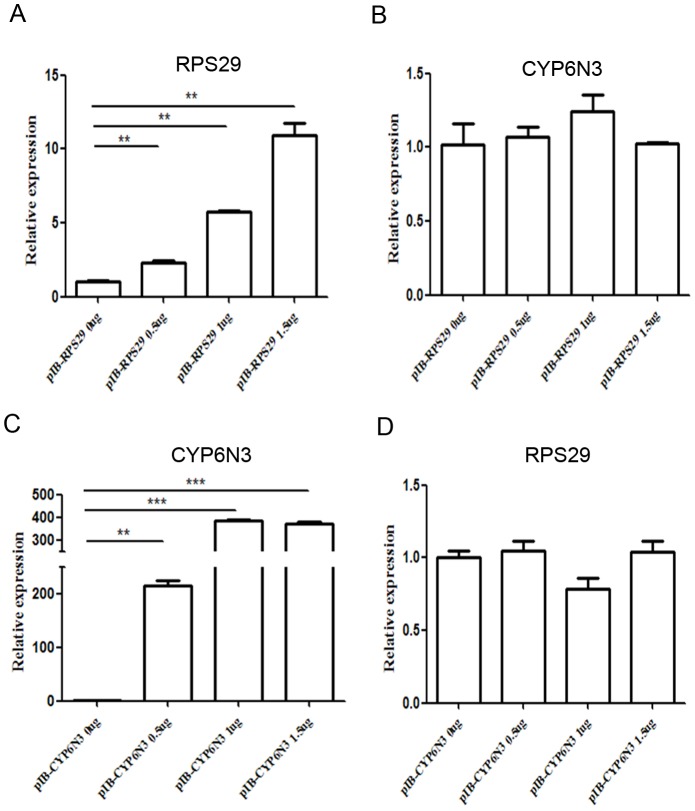
Figure 8. Real-time PCR showing mRNA levels of CYP6N3 and RPS29 are comparable to RPS29 or CYP6N3 transfected cells.
(A) Transfected C6/36 cells expressing varying amounts of RPS29 (empty vector was used as a control). Real-time PCR of CYP6N3 mRNA levels 24 h after transfection. (B) Transfected C6/36 cells expressing varying amounts of CYP6N3 (empty vector was used as a control). Real-time PCR of RPS29 mRNA levels 24 h after transfection. Expression was normalized against β-actin.

