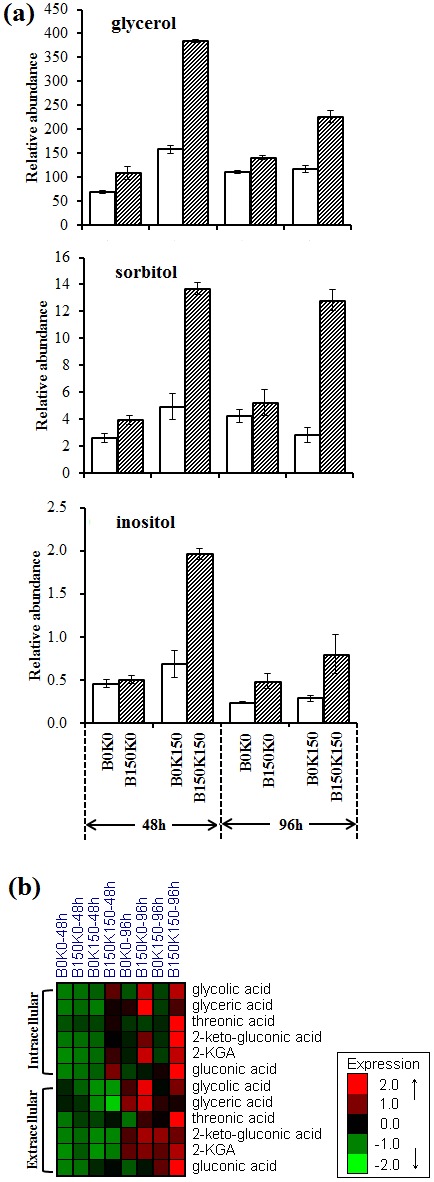
Figure 6. Changes of (a) stress related polyols and (b) oxidation related metabolites.

Each value represented mean value of four independent replicates, and the error bars show the standard deviations.

Each value represented mean value of four independent replicates, and the error bars show the standard deviations.