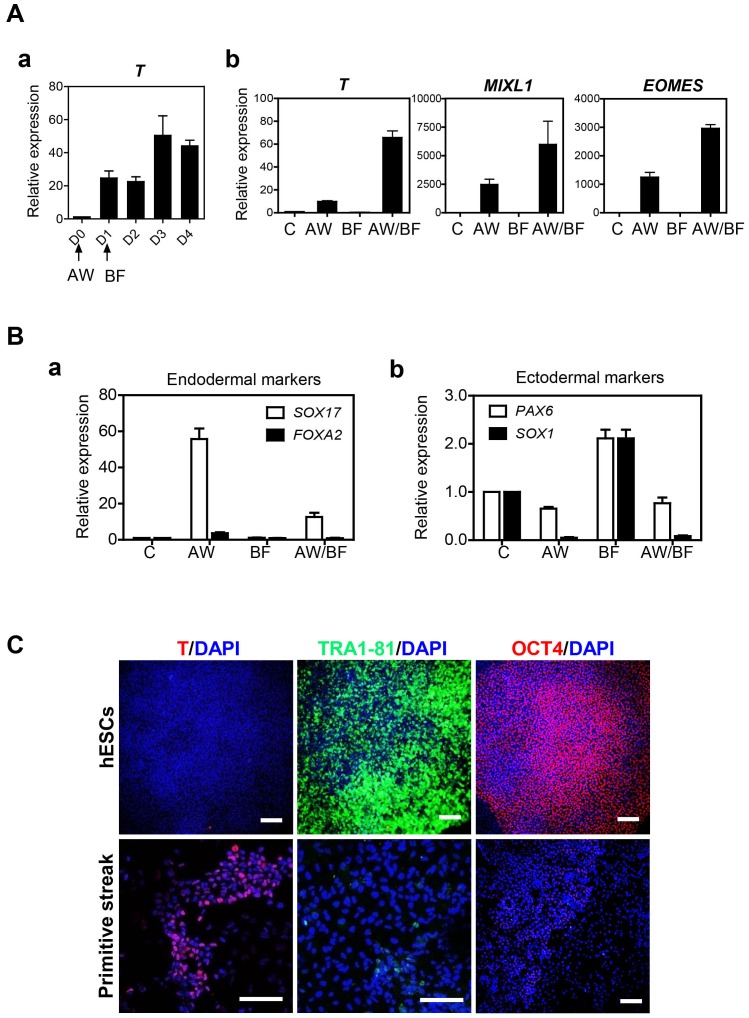
Figure 2. Induction of hESCs into primitive streak (PS) cells.
A. (a) Optimal duration for PS induction was determined by transcription level of T compared with undifferentiated hESCs before treatments. Relative gene expression was normalized to GAPDH, and the values of fold-changes are represented by mean ± S.E.M (n = 3). (b) Comparison of expression levels of PS specific genes by combinatorial treatments with exogenous factors of Activin A, Wnt3a (AW) and BMP4, FGF2 (BF), in hESC-derived PS cells. Untreated samples were designated as (C). Relative transcriptional levels were normalized to GAPDH, and the bars show mean ± S.E.M (n = 3). B. (a) Determination of heterogeneity with other germ layers such as definitive endoderm (DE) and ectoderm by evaluating transcriptional expression of (a) DE and (b) ectoderm marker genes in hESC-derived PS cells. C. Immunofluorescence of T (red), TRA1-81 (green), and OCT4 (red) expression in the cells of induction day 0 (undifferentiated hESCs) and day 3 (primitive streak). Scale bars = 200 µm.

