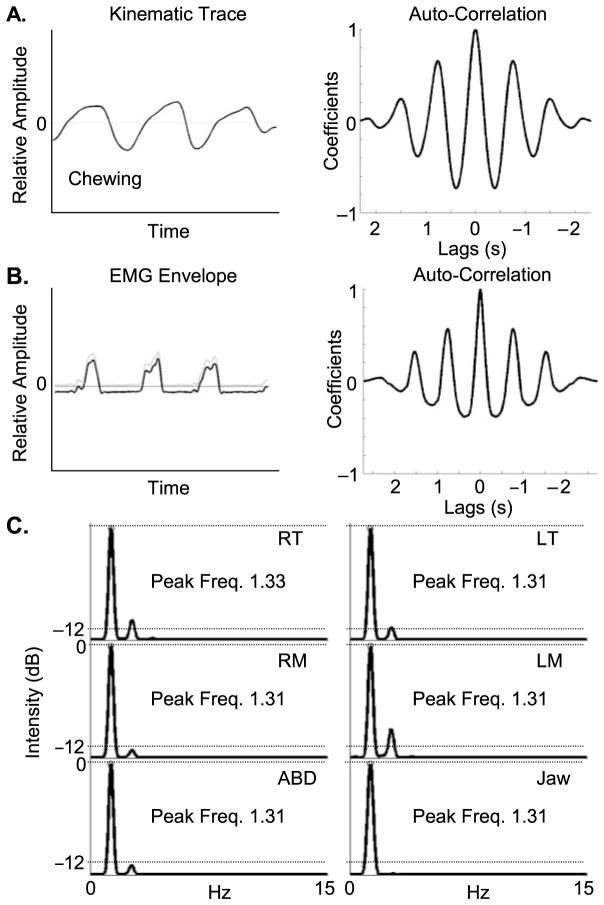
Figure 2.
Panel A illustrates the auto-correlation function computed across a detrended kinematic waveform. Panel B depicts the demeaning of an EMG amplitude envelope and the associated auto-correlation function computed across this trace. Panel C illustrates spectral compositions for jaw kinematics and EMG. The power spectra was computed across each auto-correlation function for the right temporalis (RT), left temporalis (LT), right masseter (RM), left masseter (LM), anterior belly of the digastric (ABD), and vertical jaw position (Jaw). Freq. = frequency.

