
FIGURE 3.
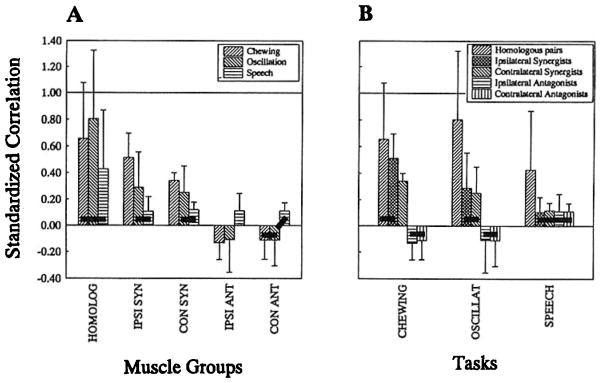
Normalized, Flsher’s-Z transformed coefficients collapsed across subjects and subtasks. Panel A plots these results by muscle group. Panel B Is a plot of the same results grouped by task. Connecting bars denote values that were not found to be statistically different In post hoc analyses.