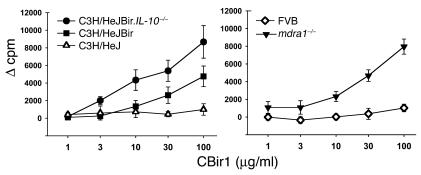
Figure 7.
Dose response of CD4+ T cell proliferation to CBir1 and Fla-X in multiple strains of mice. Left panel: C3H/HeJ (open triangles), C3H/HeJBir (squares), and C3H/HeJBir.IL-10–/– (circles). Right panel: FVB (diamonds) and mdr1a–/– (filled triangles). The y axes indicate sample counts per minute (cpm) minus control T cell plus APC cpm (Ø cpm) for each experimental group. The x axes indicate the dose (∝g/ml) of recombinant flagellin used in each assay. Vertical bars indicate plus or minus one standard deviation of the mean value.

