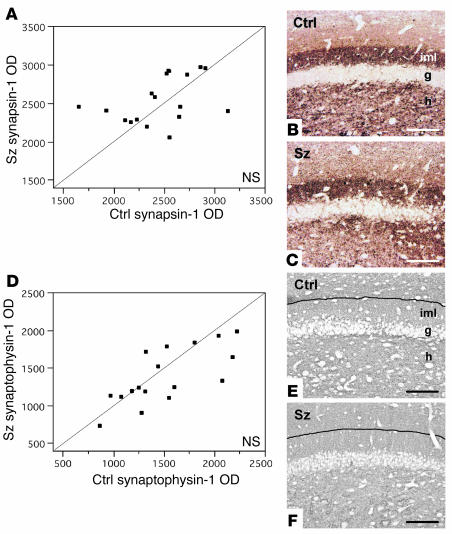
Figure 9.
Synapsin-1 and synaptophysin levels in DGiml of schizophrenia matched control cases. No significant differences between schizophrenia and control cases were found in relative OD of either synapsin-1 (A) or synaptophysin (D) immunoreactivity in DGiml. Photomicrographs from sample matched pairs illustrate synapsin-1 (B and C) and synaptophysin (E and F) immunohistochemistry in control and schizophrenia cases. Black lines in E and F indicate the boundary between the inner and outer molecular layers of the DG, evident in neighboring sections reacted for VGluT-1. The blue-gray color in E and F reflects NiSO4 intensification of immunohistochemical reaction product. Scale bars: 100 ∝m.

