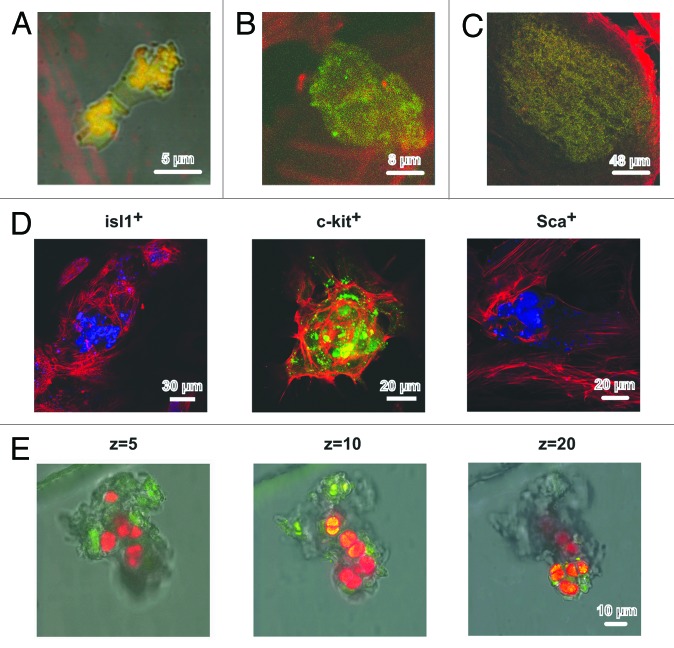
Figure 6. Structure of cardiomyocyte colonies grown in the primary culture of rat neonatal myocardial cells. (A–C) Different stages of development of the colonies stemming from Isl1+ CSCs. (A) Cell division, DIV 2. Isl1+ (FITC, green), GATA-4 (phycoerythrin, red). (B) Colony consisting of approximately 8 cells, DIV 11. Isl1+ (FITC, green), actin (rhodamine-phalloidin, red). (C) Large Isl1+ colony, DIV 11. Isl1+ (FITC, green), actin (rhodamine-phalloidin, red). (D) The optical sections of colonies formed by Isl1+, c-kit+, and Sca1+ CSCs on the 11th DIV. Isl1+ CSCs (Alexa 405, blue), Z = 12. c-kit+ CSCs (FITC, green), Z = 12. Sca1+ CSCs (Alexa 405, blue), Z = 11. Actin was stained using rhodamine-phalloidin (red). (E) Differentiation of c-kit+ CSCs inside the colony on the 13th DIV. Overlaid optical section of transmitted light and fluorescent images in 2 emitting wavelengths: 488 nm (FITC) and 543 nm (Alexa) in the bottom (Z = 5), in the middle (Z = 10), and the top (Z = 20) parts of the colony. c-kit+ expression was revealed by FITC-conjugated antibodies (green), and α-sarcomeric actinin was revealed by Alexa-conjugated antibodies (red). Confocal microscope, Leica TCS SP5 (Germany), objective ×63, oil.

An official website of the United States government
Here's how you know
Official websites use .gov
A
.gov website belongs to an official
government organization in the United States.
Secure .gov websites use HTTPS
A lock (
) or https:// means you've safely
connected to the .gov website. Share sensitive
information only on official, secure websites.
