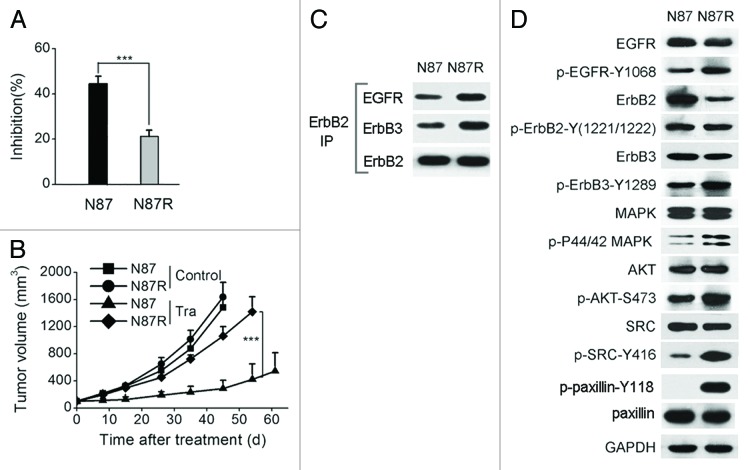
Figure 1. Characterization of trastuzumab-resistant gastric cancer cell line NCI-N87R. (A) MTS assay evaluating cell proliferation of NCI-N87 and NCI-N87R cell lines upon treatment with trastuzumab (10 μg/ml). Error bars, SD ***P < 0.0001. (B) Tumor volume of NCI-N87 and NCI-N87R xenografts after treatment with control IgG, trastuzumab, saracatinib, or trastuzumab plus saracatinib. Data are shown as means ± SEM ***P < 0.0001, Mann-Whitney test. (C) Co-immunoprecipitation assay detecting ErbB2/EGFR and ErbB2/ErbB3 heterodimerization in the NCI-N87 and NCI-N87R cell lines. (D) Immunoblots comparing major cell signaling changes between NCI-N87 and NCI-N87R cell lines.

An official website of the United States government
Here's how you know
Official websites use .gov
A
.gov website belongs to an official
government organization in the United States.
Secure .gov websites use HTTPS
A lock (
) or https:// means you've safely
connected to the .gov website. Share sensitive
information only on official, secure websites.
