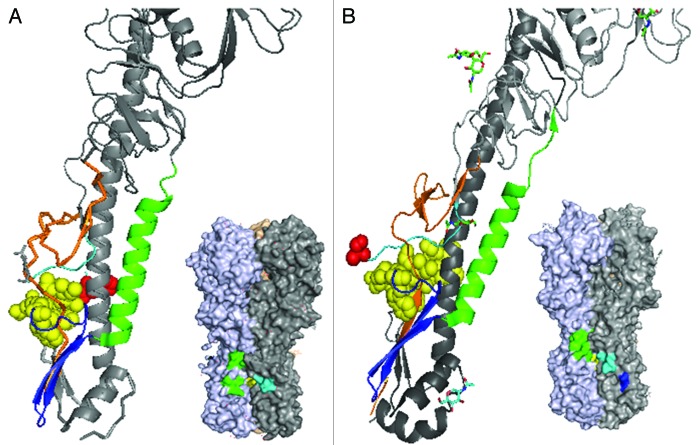
Figure 1. Structures of influenza A group 1 (A) and group 2 (B) hemagglutinin. Published crystal structures for H1N1 HA (pdb 3AL4) and H3N2 HA (pdb 1MQM) were compared by simplifying the trimers into “pretty” monomer formats revealing the tertiary positions of the sequential N-terminal HA1 region (orange), pre-fusion (light blue) and fusion region (yellow; with arginine 329 shown in red) loops, anti-parallel β sheet (royal blue) and finally the α-helical stalk region (green). Shown just below the pretty models are the corresponding 3D crystal structures with the discontinuous epitopes of the lead group 1 (mAb 53) and group 2 (mAb 579) antibodies, determined by PepScan methods. The identified epitope regions are colored according the fusion region domains as described above.

An official website of the United States government
Here's how you know
Official websites use .gov
A
.gov website belongs to an official
government organization in the United States.
Secure .gov websites use HTTPS
A lock (
) or https:// means you've safely
connected to the .gov website. Share sensitive
information only on official, secure websites.
