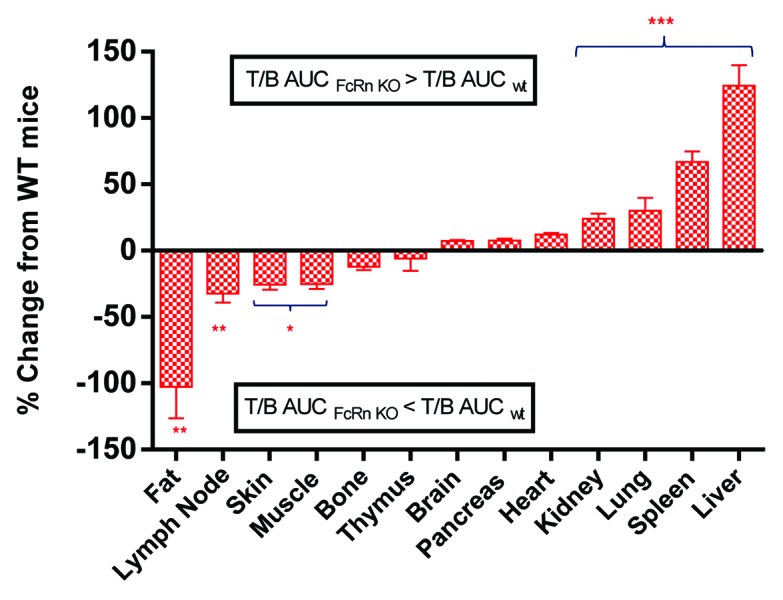
Figure 3. Percentage change of tissue-to-blood area under the curve (T/B AUC) ratio (0–96 h) in FcRn knockout (KO) mice relative to wild-type (WT) mice. The percentage of change was calculated as either an increase or a decrease of T/B AUCKO/T/B AUCWT ratio relative to T/B AUCWT. Values are presented as mean ± s.e.mean. n = 18. *P < 0.05, **P < 0.001, ***P < 0.0001 compared with wild-type mice.
