
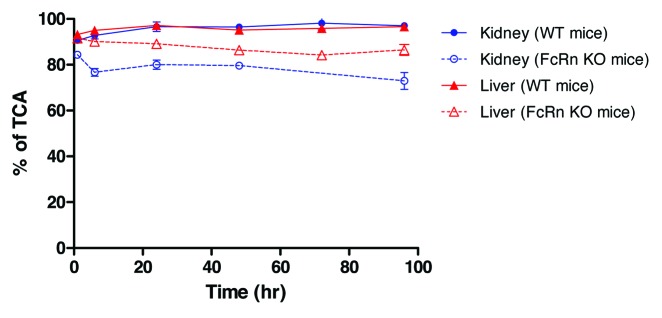
Figure 4. Percentage of post-TCA precipitation of the kidney and liver samples in C57BL/6 wild-type (WT) and FcRn knockout (KO) mice. Each time point is a terminal collection of 3 animals from each strain. Each time point is presented as the mean ± SD.