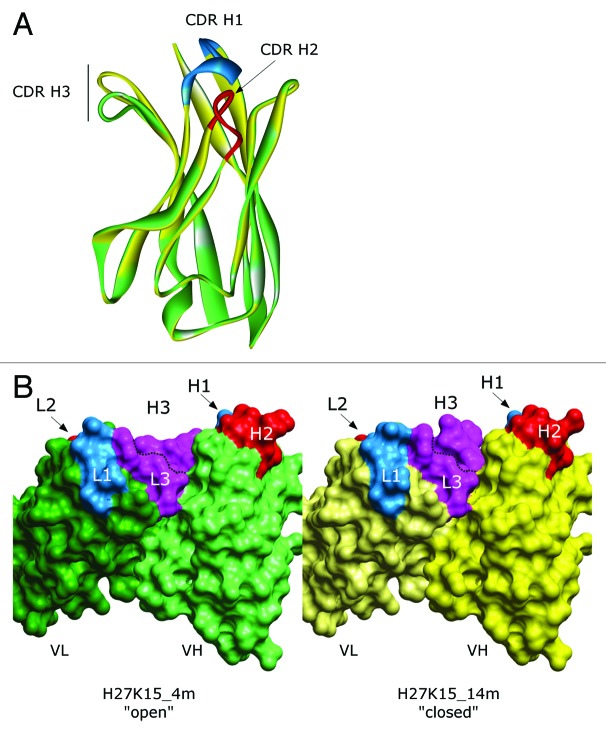
Figure 1. Homology models of the H27K15 mAb variable region. (A) Ribbon diagram of VH conformations. Green: model named “4m” with opened CDR H3 conformation; yellow, model with closed CDR H3 conformation named “14m”; CDR H1 and CDR H2 are shown in blue and red, respectively. (B) Solvent accessible surface of H27K15 4m (left panel) and 14m (right panel) Fv fragments; light chains (dark green, 4m; light yellow, 14m) and heavy chains (light green, 4m; dark yellow, 14m) are indicated together with CDR1 (blue), CDR2 (red) and CDR3 (purple).

An official website of the United States government
Here's how you know
Official websites use .gov
A
.gov website belongs to an official
government organization in the United States.
Secure .gov websites use HTTPS
A lock (
) or https:// means you've safely
connected to the .gov website. Share sensitive
information only on official, secure websites.
