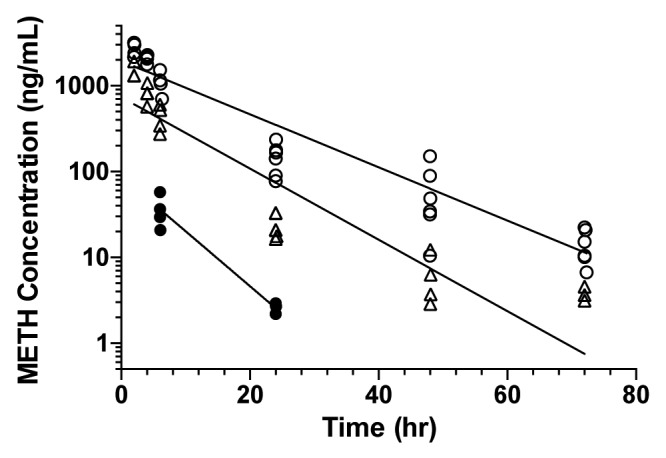
Figure 3. METH concentrations vs. time in the presence of anti-METH mAbs. Data points from individual rats are graphed; lines were fit to the average concentration at each time point because each animal was typically sampled only every other time. Rats received 15 mg/kg ch-mAb7F9 (closed circles), 150 mg/kg ch-mAb7F9 (open circles), or 150 mg/kg mAb7F9 (open triangles).
