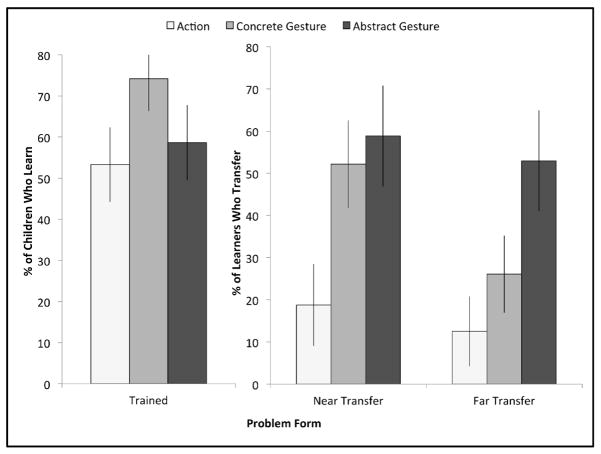
Figure 3.
The left-most graph shows the percentage of all children we succeeded on trained problems (learners). The middle graph shows the percentage of learners who also succeeded on near-transfer problems. The right graph shows the percentage of learners who succeeded on both near-transfer and far-transfer problems. Error bars represent the standard error of the percentages.

