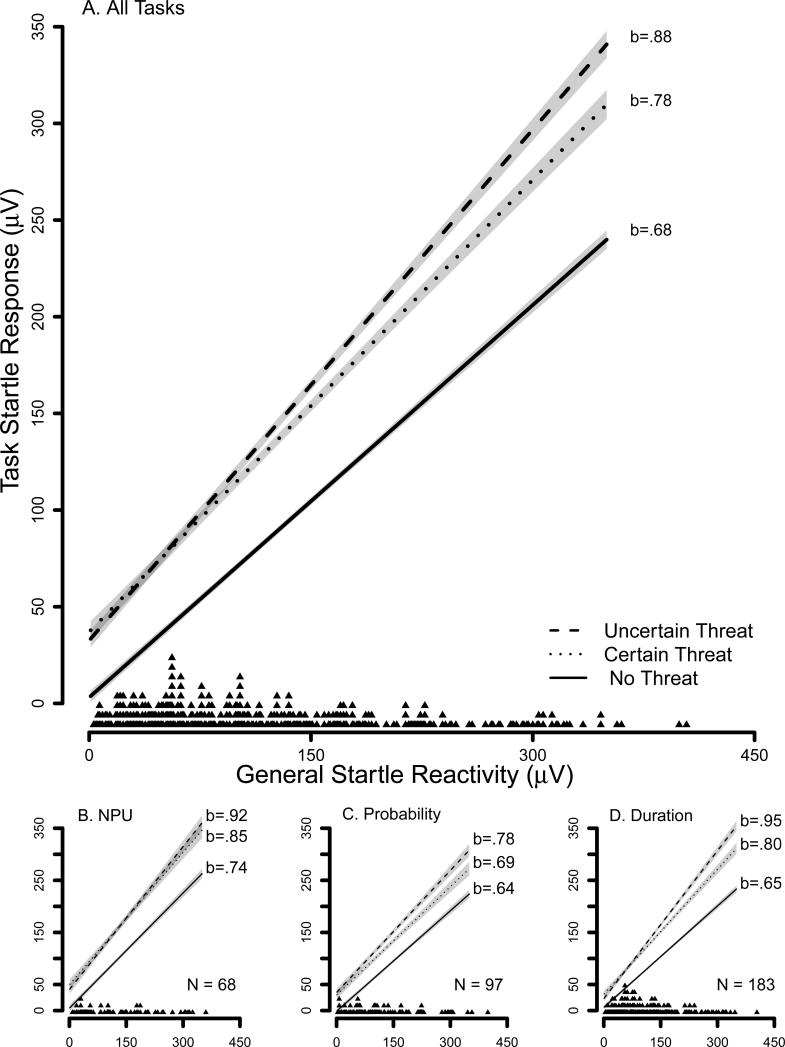
Figure 1. Startle Response by General Startle Reactivity and Condition.
Gray bands indicate confidence envelopes (+/− one standard error) for point estimates of startle response from the general linear model (GLM). We included a strip plot of General startle reactivity for all participants along each x-axis. We report GLM coefficients for the simple effects in each condition. Panel A displays aggregate data across the three tasks. Panels B-D display data separately for the three tasks.

